
CASE STUDY · ICA 25TH ANNIVERSARY GALLERY
The Story Between the Answers
Learning to look beyond survey responses to understand what people really value.
Ongoing This project is still in progress.
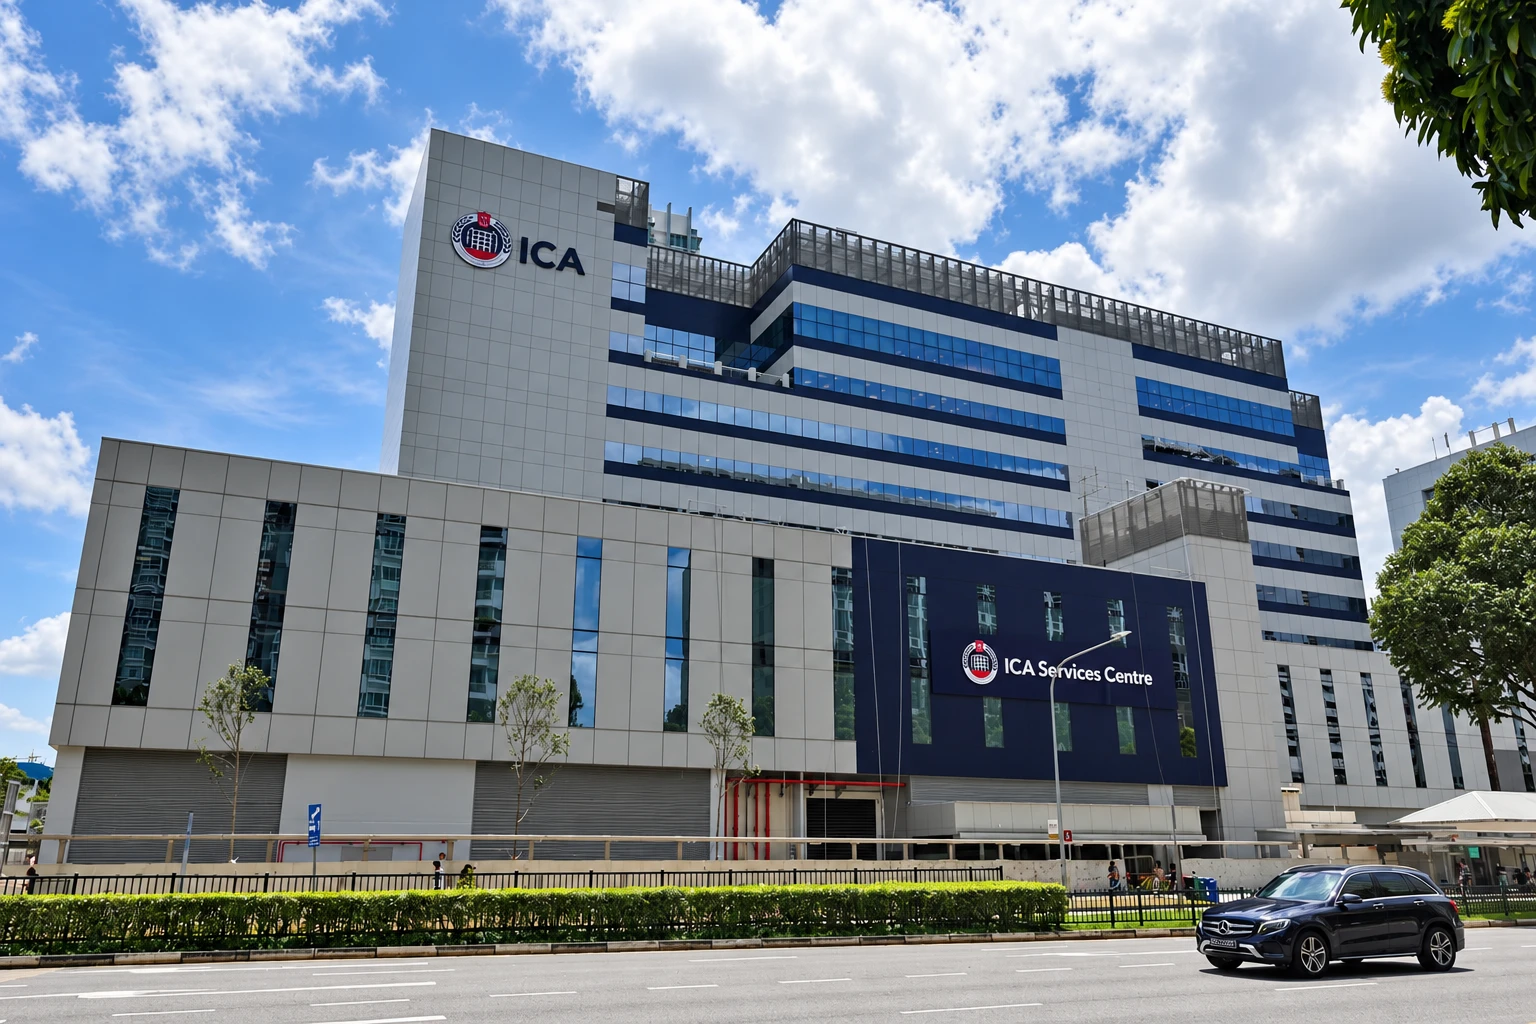
CLIENT
Immigration & Checkpoints Authority (ICA)
PROJECT
ICA 25th Anniversary Gallery
MY ROLE
Research Associate
TIMELINE
2026 · Ongoing
METHODS
Desktop research, site visits, survey, focus groups
The challenge
How do you create a gallery experience that feels meaningful to people who aren't necessarily there to visit one?
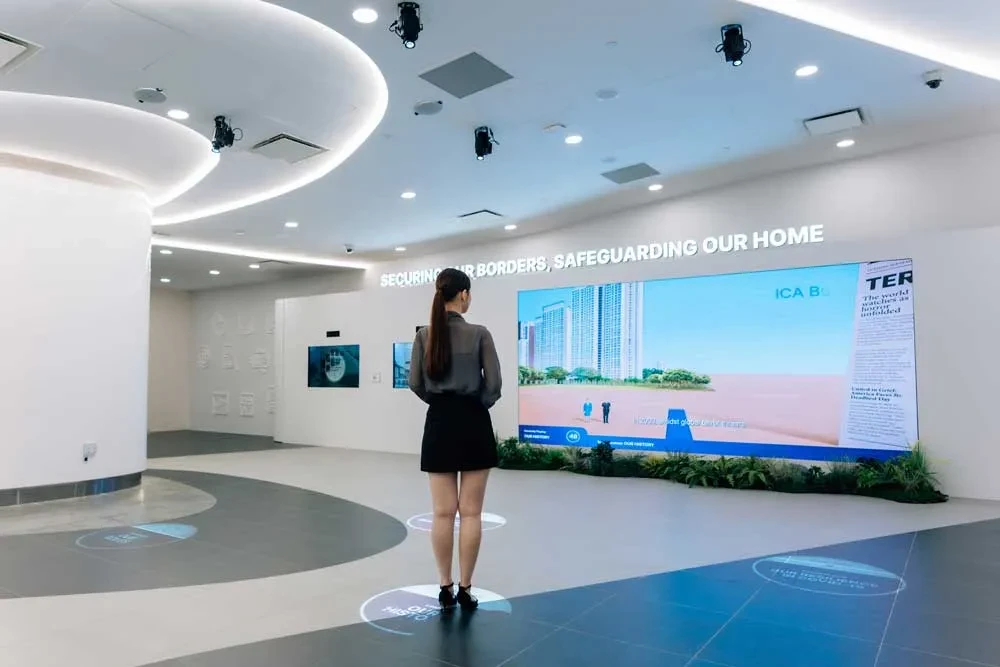
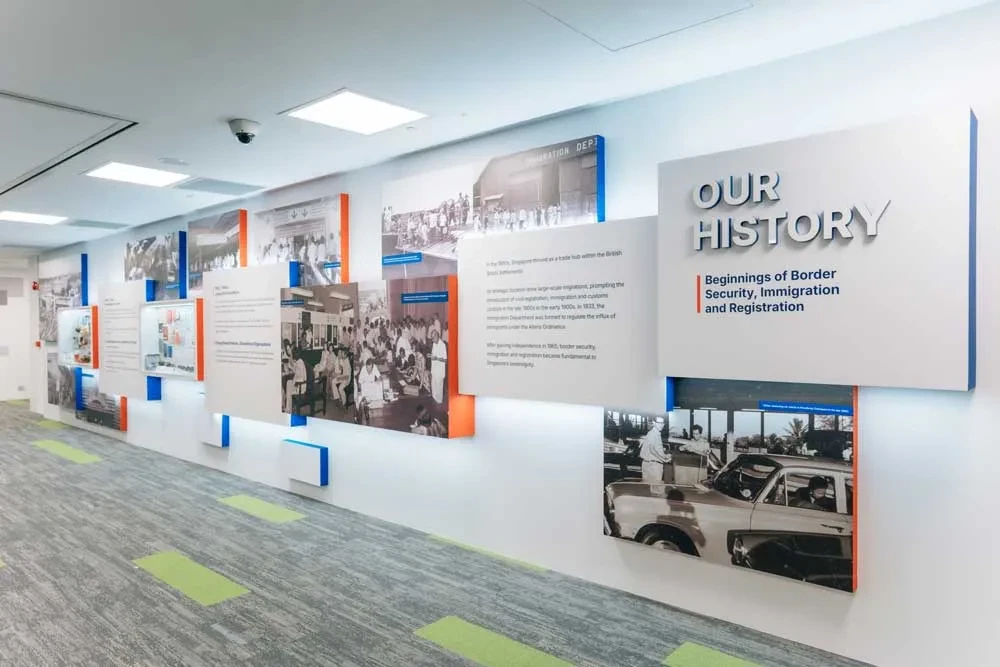
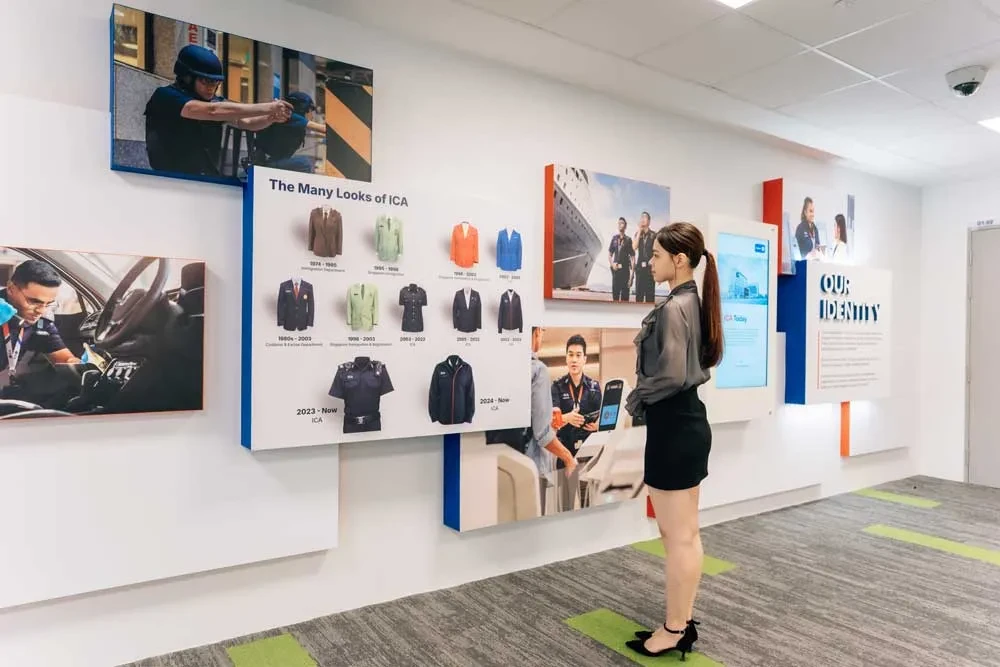
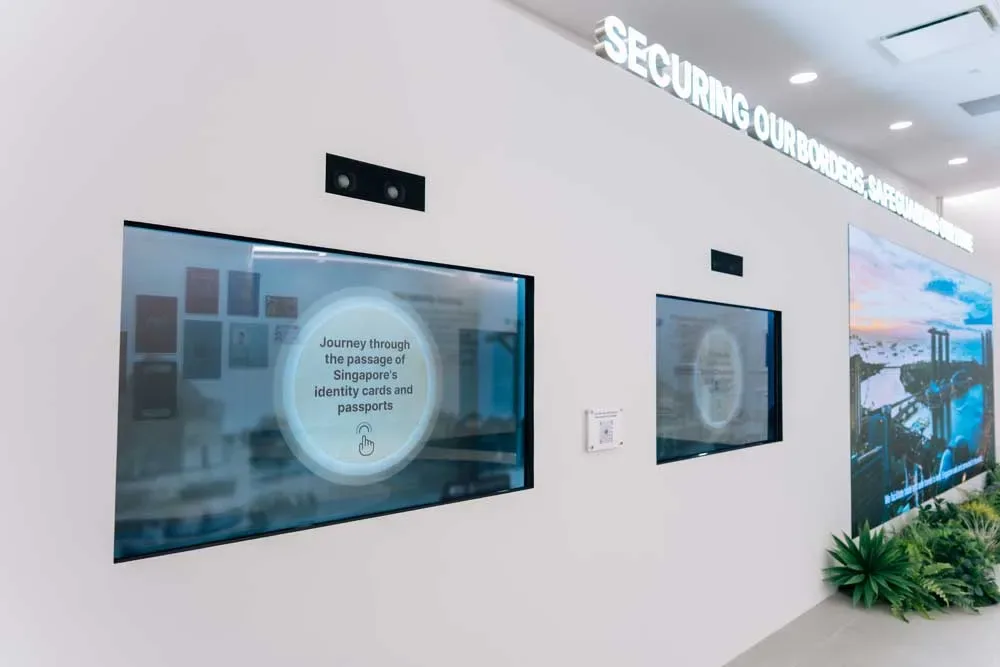
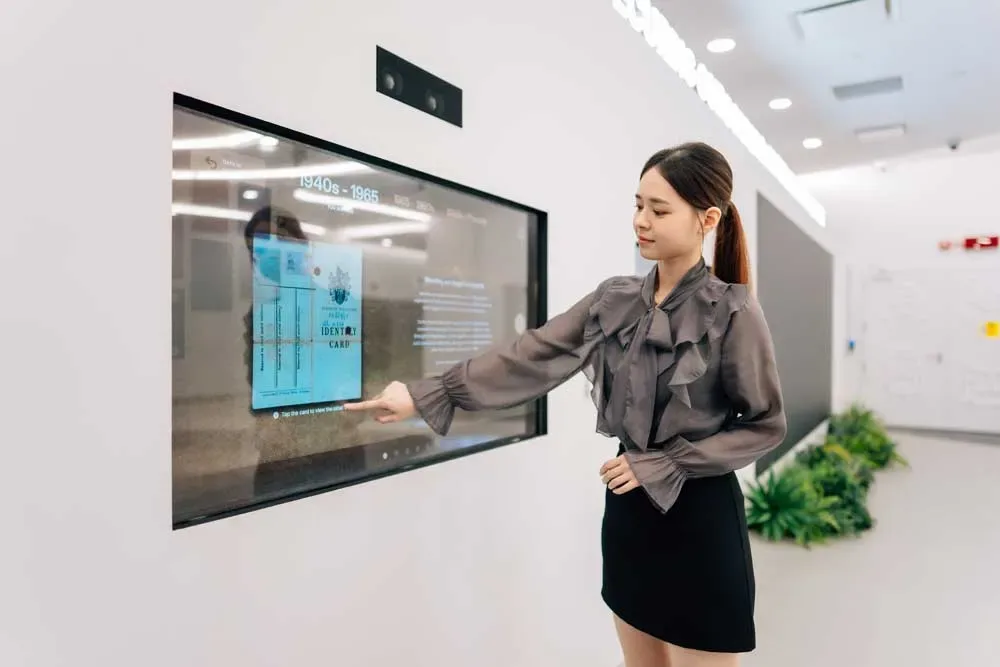
The ICA 25th Anniversary Gallery project sought to reimagine how visitors could engage with and learn about the organisation beyond its everyday services. Unlike traditional museums, where people intentionally visit to explore and learn, many visitors to ICA arrive with a specific task in mind. This presented an interesting challenge.
THE QUESTION WE HAD TO ANSWER
How do we encourage people to engage with a gallery when their primary reason for being there has nothing to do with it?
And more importantly, how do we create an experience that feels relevant to people with different needs, interests and expectations?
I supported the wider research programme, with a particular focus on understanding public perceptions and identifying what people might find meaningful in the future gallery experience.
What I did
01
Survey analysis
02
Research synthesis
03
Reporting
Understanding people from different angles
No single research method could give us the complete picture.
Our team adopted a mixed-method research approach to understand visitor behaviour, public perceptions and expectations from different perspectives.
01
Desktop & landscape research
Reviewing comparable museums, galleries and interactive experiences to understand existing approaches and opportunities.
02
Site visits & ethnographic observation
Observing visitor behaviour, movement, attention and interactions within physical environments.
03
Public perception & interest survey
Understanding broader public attitudes, interests and expectations through quantitative and qualitative responses.
04
Focus group discussions (FGDs)
Exploring perspectives from internal stakeholders, members of the public, students and educators.
Together, these methods helped the team develop a broader understanding of the people we were designing for.
WHERE I CAME IN
My main responsibility was analysing and synthesising the public-perception survey.
I started by studying the quantitative results to identify broader patterns, then examined the qualitative feedback to understand what those patterns might mean. And this was where things became interesting.
Core discoveries
What the survey showed, including the parts that didn't add up at first.
DISCOVERY 01
When the answers don't quite add up
Sometimes, the most interesting part of research is finding something that doesn't immediately make sense.
While analysing the survey, I noticed something that made me question my initial interpretation.
USEFUL AND EDUCATIONAL
Respondents expressed the importance of useful and educational content.
BUT ALSO CURIOUS ABOUT
Personal stories, behind-the-scenes experiences and things they wouldn't normally encounter.
At first, these seemed like different preferences. But I began questioning whether we were interpreting usefulness too narrowly.
THE QUESTION I ASKED
Does useful content always need to provide practical information? Or could understanding something unfamiliar, including the people and experiences behind it, be valuable in its own right?
Rather than immediately treating the responses as contradictory, I wanted to understand what they might be telling us together.
WHAT IT REMINDED ME
It reminded me that the most popular answer isn't necessarily the most meaningful finding. Sometimes, it's the relationship between answers that deserves a closer look.

Making sense of the bigger picture
Working with a large dataset meant knowing what to focus on, and what to leave out.

THE CHALLENGE
An endless collection of statistics
One of the challenges was making sure the analysis didn't become an endless collection of statistics and interesting comments. Not every recurring topic was an insight. Not every unusual response represented a wider audience need.
WHAT I DID
I focused on using the quantitative data to establish patterns, with qualitative responses providing additional context where appropriate.
THE CHALLENGE
A tight turnaround
I also had to work within a tight turnaround to turn the analysis into a clear, client-facing presentation.
WHAT I DID
This meant being selective about what mattered, organising findings around the research objectives and explaining why the results were relevant to the wider project.
The goal wasn't to present everything we collected. It was to help the team understand what the research was telling us.
From research to direction
Research is only useful when we understand what the findings mean for the experience.
The survey analysis formed part of a wider research effort that brought together evidence from different methods.
MY CONTRIBUTION
My contribution was to identify meaningful patterns, question interpretations and communicate the findings clearly enough for the team to discuss their implications.
Working alongside senior researchers also helped me understand how individual findings contribute to a broader research direction, while recognising that the overall strategy depends on evidence from multiple sources. This experience strengthened my ability to move beyond describing survey results and consider what they could mean for the gallery's design.
Looking back
This project taught me that research isn't always about finding the answer. Sometimes, it's about questioning the answer we think we've found.
Working through a large dataset challenged me to think carefully about how I interpreted evidence. Two responses that appear unrelated might point towards a common underlying need. Equally, something that looks like a contradiction might simply reflect different ways people express what they value.
I learnt to be more selective with evidence, more careful with assumptions and more deliberate about connecting findings back to the research objectives.
Most importantly, it reinforced why I enjoy research.
WHY I ENJOY RESEARCH
I love the moment when seemingly unrelated pieces of information begin to connect, and I start to understand something I hadn't considered before.

NEXT PROJECT
H365 Suite